Introduction
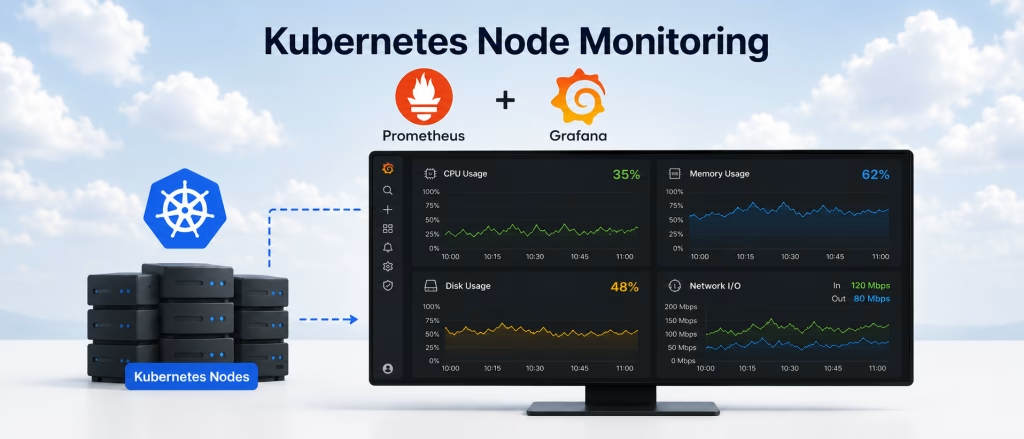
Prometheus and Grafana for Kubernetes node monitoring is an important step for running stable disconnected or air gapped Kubernetes clusters in production. Kubernetes can reschedule pods when a node fails, but it does not replace the need to understand why the node became unhealthy in the first place. For hardware status monitoring, the best approach is to use Prometheus with node-exporter and Grafana as one monitoring stack. This article explains how to monitor Kubernetes node hardware status using the Prometheus and Grafana stack.
The Main Question
If we want to monitor the hardware status of nodes in Kubernetes, the best way is to collect host-level metrics from every Kubernetes node and visualize them together with Kubernetes object status.
The recommended stack is:
- node-exporter for Linux node hardware and operating system metrics
- Prometheus for metric scraping, storage, and PromQL queries
- kube-state-metrics for Kubernetes object state
- Alertmanager for alert routing and notification
- Grafana for dashboards and operational visibility
For most Kubernetes environments, the easiest and cleanest deployment method is the kube-prometheus-stack Helm chart. It deploys the main components together and provides a production-oriented starting point.
Why Node Hardware Monitoring Matters
Kubernetes nodes are still physical or virtual machines. Even when the platform abstracts workloads into pods, the real limits are still on the node level.
A node can become unstable because of:
- High CPU usage
- Memory pressure
- Disk pressure
- Filesystem saturation
- Slow or failing disks
- Network packet drops
- Network interface errors
- Kernel-level resource exhaustion
- Node reboot or hardware failure
Kubernetes may show that a node is NotReady, but this is usually a late signal. Good hardware monitoring would detect the problem earlier, before scheduling, application availability, or storage performance is affected.
Procedure
Step 1: Create a Monitoring Namespace
Create a dedicated namespace for the monitoring stack.
$ kubectl create namespace monitoringStep 2: Add the Prometheus Community Helm Repository
Add the Helm repository that contains kube-prometheus-stack.
$ helm repo add prometheus-community https://prometheus-community.github.io/helm-charts
$ helm repo update
Step 3: Create a Values File
In order to customize the deployment to your Kubernetes environment, the values.yaml changes a few things in the operator.
Create a file named values.yaml.
grafana:
  enabled: true

  ingress:
    enabled: true
    ingressClassName: nginx # or cillium
    hosts:
    - grafana.k8s.co.il
    path: /
    pathType: Prefix

prometheus:
  prometheusSpec:
    retention: 15d
    storageSpec:
      volumeClaimTemplate:
        spec:
          storageClassName: fast-storage
          accessModes:
          - ReadWriteOnce
          resources:
            requests:
              storage: 100Gi
In production, the Grafana password should not be stored directly in a plain values file. It is better to use an existing Kubernetes Secret or an external secret management solution.
Step 4: Install kube-prometheus-stack
Install the stack into the monitoring namespace.
$ helm install kube-prometheus-stack prometheus-community/kube-prometheus-stack \
  --namespace monitoring \
  -f values.yaml
This installs the core monitoring components:
- Prometheus
- Prometheus Operator
- Alertmanager
- Grafana
- node-exporter
- kube-state-metrics
- default dashboards
- default alert rules
Step 5: Verify the Monitoring Pods
Check that the monitoring pods are running.
$ kubectl get pods -n monitoringYou should see pods similar to:
$ k get pods
NAME                                                        READY   STATUS        RESTARTS   AGE
alertmanager-kube-prometheus-stack-alertmanager-0           2/2     Running       0          7m32s
kube-prometheus-stack-grafana-864d797868-gn5zg              3/3     Running       0          7m41s
kube-prometheus-stack-kube-state-metrics-6b747b7c5f-8f26r   1/1     Running       0          7m41s
kube-prometheus-stack-operator-5d679799b9-64wsq             1/1     Running       0          7m41s
kube-prometheus-stack-prometheus-node-exporter-7cbkx        1/1     Running       0          7m41s
kube-prometheus-stack-prometheus-node-exporter-j2t2r        1/1     Running       0          7m41s
The prometheus-node-exporter component is usually deployed as a DaemonSet so that every node exposes hardware and operating system metrics.
Step 6: Check the Node Exporter DaemonSet
Run:
$ kubectl get daemonset -n monitoringLook for:
$ kubectl get daemonset -n monitoring
NAME                                             DESIRED   CURRENT   READY   UP-TO-DATE   AVAILABLE   NODE SELECTOR            AGE
kube-prometheus-stack-prometheus-node-exporter   4         4         2       4            2           kubernetes.io/os=linux   8m10s
Then check if it has one pod per node:
$ kubectl get pods -n monitoring -o wide | grep node-exporterIf a node does not have a node-exporter pod, Prometheus will not collect hardware metrics from that node.
Step 7: Verify the Grafana Ingress
Check that the Grafana Ingress was created.
$ kubectl get ingress -n monitoringExpected output should include an Ingress for Grafana:
NAME                            CLASS   HOSTS                    ADDRESS
kube-prometheus-stack-grafana   nginx   grafana.k8s.co.il  192.168.10.50
Step 8: Access Grafana Through Ingress
Open Grafana in the browser:
http://grafana.k8s.co.ilThe admin secret can be retrived using:
$ kubectl --namespace monitoring get secrets kube-prometheus-stack-grafana -o jsonpath="{.data.admin-password}" | base64 -d ; echoAfter logging in, search for dashboards related to:
- Node Exporter
- Nodes
- Kubernetes compute resources
- Kubernetes cluster overview
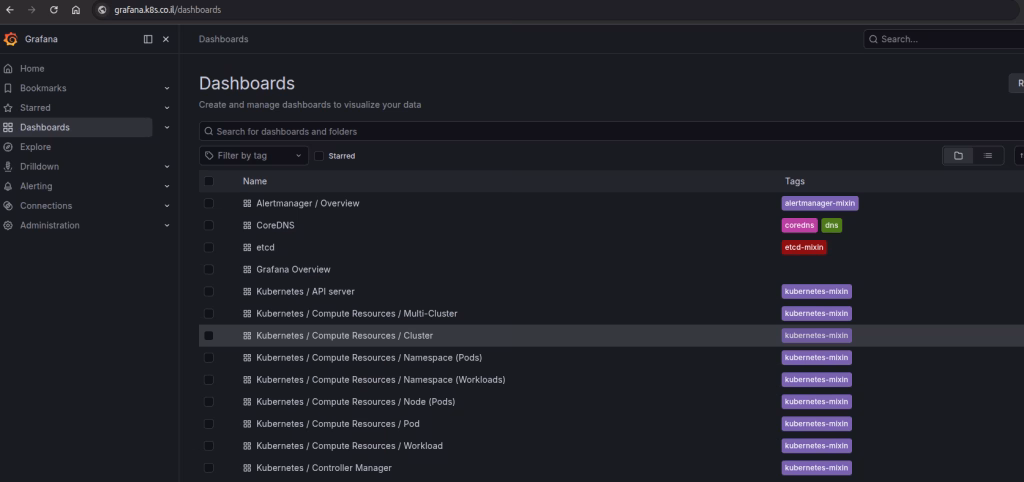
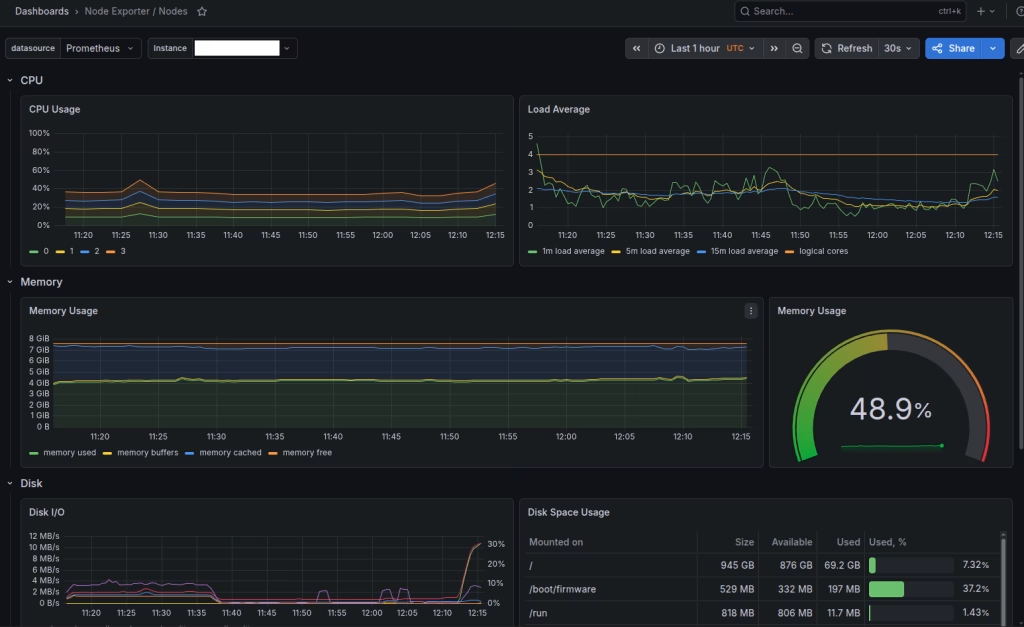
The node-exporter dashboards are usually the most useful for hardware monitoring. They show CPU, memory, filesystem, disk I/O, and network metrics.
What Should Be Monitored
A good Kubernetes node hardware monitoring design should include several layers.
CPU
CPU monitoring should include total usage, idle time, system time, user time, steal time, and load average. In virtualized environments, CPU steal time is especially important because it may show that the VM is waiting for CPU resources from the hypervisor.
Useful Prometheus metrics include:
node_cpu_seconds_total
node_load1
node_load5
node_load15
Example PromQL query for CPU usage:
100 - (avg by(instance) (rate(node_cpu_seconds_total{mode="idle"}[5m])) * 100)Memory
Memory monitoring should not only show used memory. Linux uses memory for cache and buffers, so it is better to monitor available memory.
Useful metrics include:
node_memory_MemTotal_bytes
node_memory_MemAvailable_bytes
node_memory_Buffers_bytes
node_memory_Cached_bytes
Example PromQL query for memory usage:
100 * (1 - (node_memory_MemAvailable_bytes / node_memory_MemTotal_bytes))Disk Capacity
Disk monitoring should include filesystem usage, available space, inode usage, and mount status. This is critical for Kubernetes nodes because full filesystems can affect container runtime, image pulls, logs, and local volumes.
Useful metrics include:
node_filesystem_size_bytes
node_filesystem_avail_bytes
node_filesystem_files
node_filesystem_files_free
Example PromQL query for filesystem usage:
100 * (1 - (node_filesystem_avail_bytes{fstype!~"tmpfs|overlay"} / node_filesystem_size_bytes{fstype!~"tmpfs|overlay"}))Disk I/O
Disk I/O monitoring helps detect slow disks, overloaded storage, or noisy workloads. This is important for nodes running databases, logging workloads, container registries, or local persistent volumes.
Useful metrics include:
node_disk_read_bytes_total
node_disk_written_bytes_total
node_disk_io_time_seconds_total
node_disk_reads_completed_total
node_disk_writes_completed_total
Example PromQL query for disk utilization:
rate(node_disk_io_time_seconds_total[5m]) * 100Network
Network monitoring should include traffic, packet drops, errors, and interface status. In Kubernetes, network issues may appear as application errors, DNS failures, pod-to-pod communication failures, or storage connectivity problems.
Useful metrics include:
node_network_receive_bytes_total
node_network_transmit_bytes_total
node_network_receive_errs_total
node_network_transmit_errs_total
node_network_receive_drop_total
node_network_transmit_drop_total
Example PromQL query for receive errors:
rate(node_network_receive_errs_total[5m])Node Status
Hardware monitoring should be connected with Kubernetes node status. This is where kube-state-metrics is useful.
Useful metrics include:
kube_node_status_condition
kube_node_info
kube_node_spec_taint
Example query for nodes that are not ready:
kube_node_status_condition{condition="Ready",status="true"} == 0Grafana Dashboard Examples
With the helm chart we get built in charts, here are dashboard examples for what should be monitored:
Node Monitoring
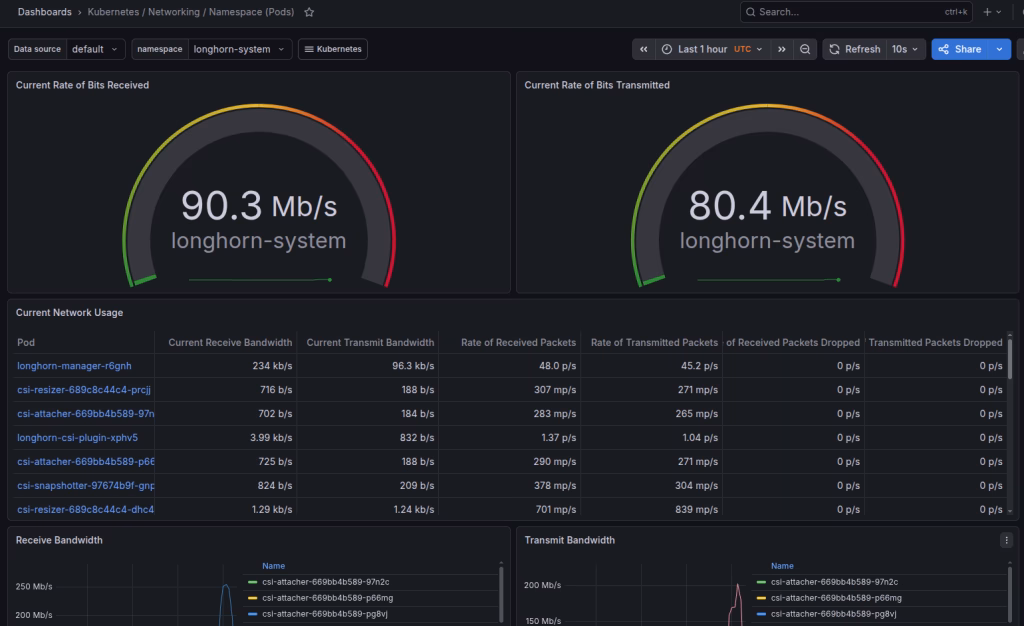
Network Monitoring
As you can see, the longhorn-system is using 90Mb/s ingress and 80.4 Mb/s egress.
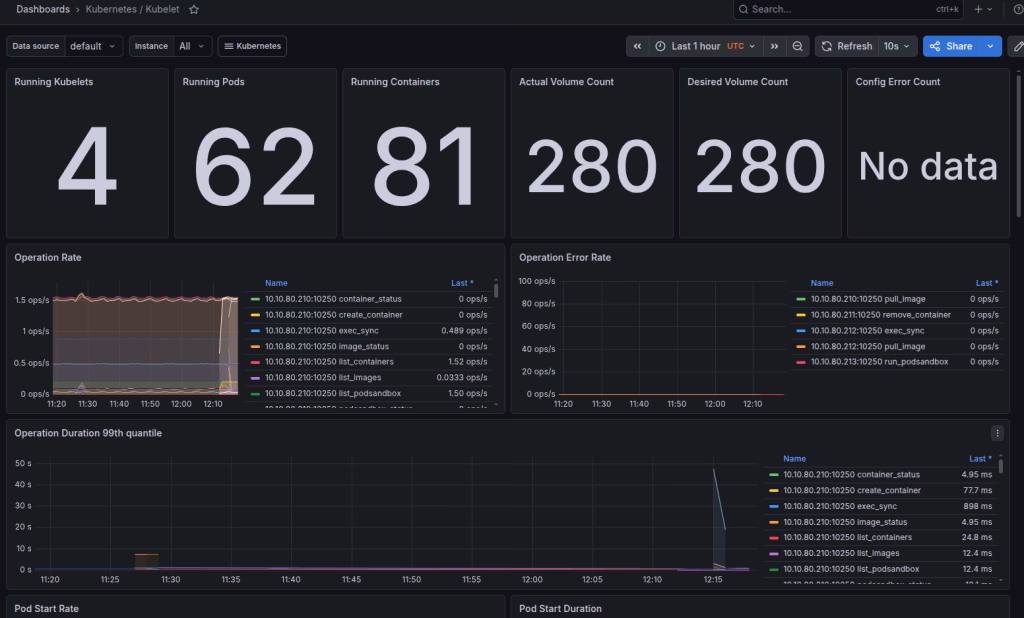
Kubelet
This is for the entire cluster, in our case 4 nodes in the cluster with 81 containers inside 62 pods.
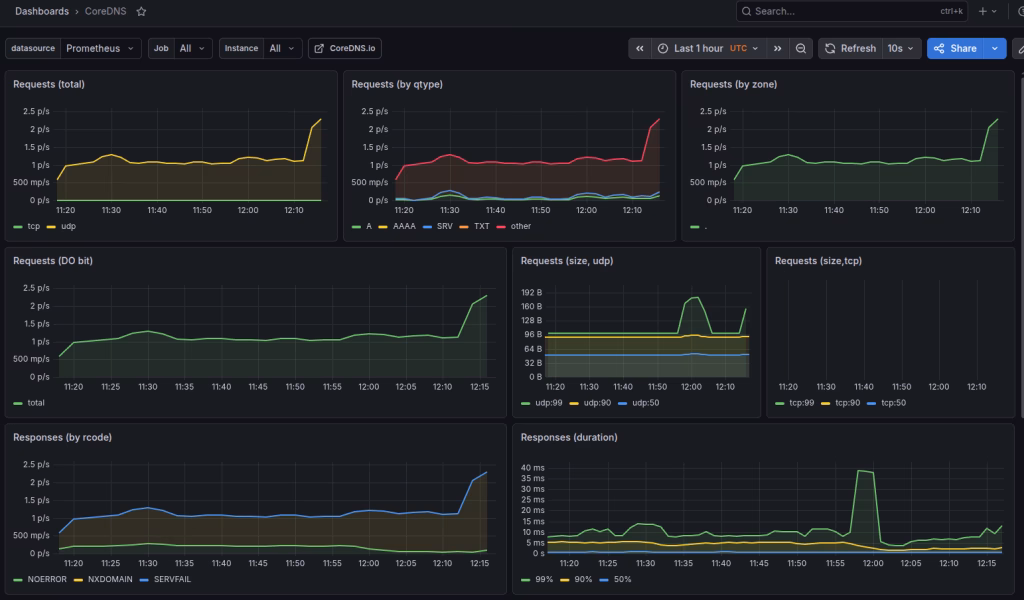
CoreDNS
In this example we can see the CoreDNS dashboard, the main DNS service in Kubernetes. Therefor, it’s important to know if CoreDNS is functioning properly. We can see how many requests and by which type were done inside the cluster.
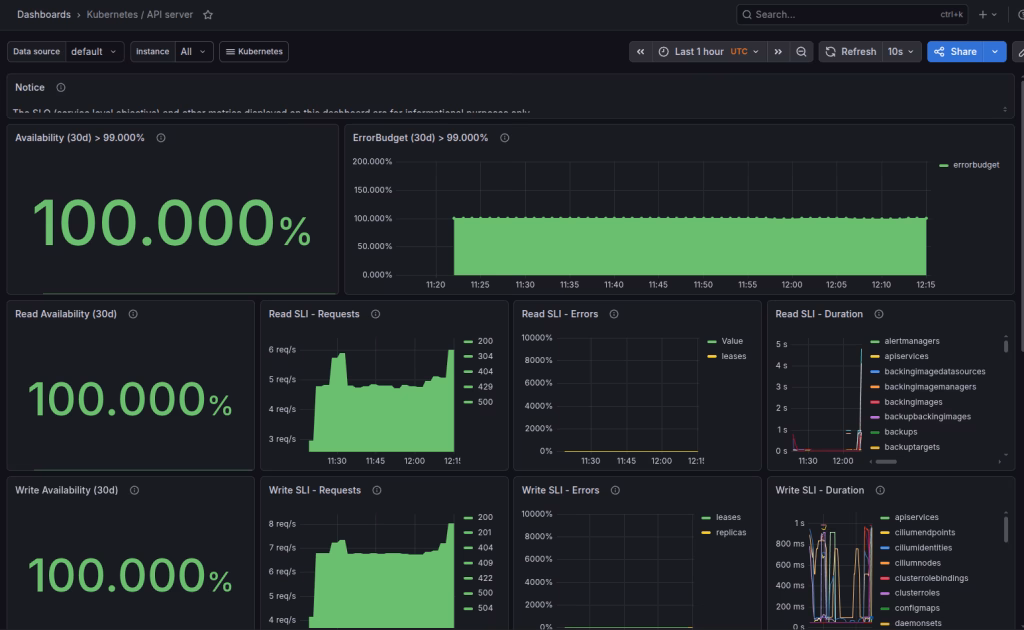
API Server
Create Basic Hardware Alerts
A monitoring system is not complete without alerts. In other words, dashboards are good for investigation, but alerts are what we need for operational response.
Here’s an example alert for high CPU usage:
apiVersion: monitoring.coreos.com/v1
kind: PrometheusRule
metadata:
  name: node-hardware-alerts
  namespace: monitoring
spec:
  groups:
  - name: node.hardware.rules
    rules:
    - alert: NodeHighCPUUsage
      expr: 100 - (avg by(instance) (rate(node_cpu_seconds_total{mode="idle"}[5m])) * 100) > 85
      for: 10m
      labels:
        severity: warning
      annotations:
        summary: "High CPU usage on node"
        description: "Node {{ $labels.instance }} has CPU usage above 85% for more than 10 minutes."
And here is another example alert for low memory:
    - alert: NodeLowAvailableMemory
      expr: 100 * (node_memory_MemAvailable_bytes / node_memory_MemTotal_bytes) < 10
      for: 10m
      labels:
        severity: warning
      annotations:
        summary: "Low available memory on node"
        description: "Node {{ $labels.instance }} has less than 10% available memory."
Lastly, an example alert for high filesystem usage:
    - alert: NodeFilesystemAlmostFull
      expr: 100 * (1 - (node_filesystem_avail_bytes{fstype!~"tmpfs|overlay"} / node_filesystem_size_bytes{fstype!~"tmpfs|overlay"})) > 85
      for: 15m
      labels:
        severity: warning
      annotations:
        summary: "Filesystem almost full"
        description: "Filesystem on {{ $labels.instance }} is above 85% usage."
Apply the alert file:
$ kubectl apply -f node-hardware-alerts.yamlConfigure Alertmanager
Alertmanager should route alerts to the right team or system. In a production environment, this can be email, Slack, Microsoft Teams, PagerDuty, Opsgenie, or a webhook.
A simple route may look like this:
route:
  receiver: platform-team
  group_by:
  - alertname
  - instance
  group_wait: 30s
  group_interval: 5m
  repeat_interval: 4h

receivers:
- name: platform-team
  email_configs:
  - to: platform-team@example.com
    from: prometheus@example.com
    smarthost: smtp.example.com:587
    auth_username: prometheus@example.com
    auth_password: example-password
In production, passwords should be managed through Kubernetes Secrets or an external secret management solution.
Production Considerations
Use Persistent Storage for Prometheus
Prometheus should use persistent storage so that metrics are not lost when the Prometheus pod restarts.
Example values:
prometheus:
  prometheusSpec:
    storageSpec:
      volumeClaimTemplate:
        spec:
          storageClassName: fast-storage
          accessModes:
          - ReadWriteOnce
          resources:
            requests:
              storage: 100Gi
Set Retention Policy
Decide how long metrics should be stored locally.
prometheus:
  prometheusSpec:
    retention: 15d
For long-term storage, consider remote write to a long-term metrics platform.
Secure Grafana Access
Grafana should not be exposed without proper access control. consider the following:
- HTTPS with a valid certificate
- SSO integration
- strong admin password rotation
- limited public exposure
- network restrictions
- separate read-only users for dashboards
Grafana is an operational interface. It should be treated as part of the platform management layer and not as a public application.
Avoid Too Many Alerts
Hardware alerts should be useful and actionable. Too many alerts create noise and reduce trust in the monitoring system.
Start with a small set:
- Node not ready
- High CPU for a sustained period
- Low available memory
- Filesystem almost full
- Disk I/O saturation
- Network errors or drops
- node-exporter target down
Then improve the alert rules based on real incidents.
What About Vendor Hardware Sensors?
node-exporter provides strong operating system and hardware-related metrics, but it does not always expose every physical hardware sensor.
For deeper hardware status, such as power supply, fan status, RAID controller state, disk SMART status, or server temperature, additional exporters may be required.
Examples include:
- IPMI exporter for server management interfaces
- SMART exporter for disk health
- vendor-specific exporters for storage or server platforms
- DCGM exporter for NVIDIA GPU monitoring
For general Kubernetes node monitoring, node-exporter is the base. For physical hardware health, it should be extended with hardware-specific exporters.
Summary
Prometheus and Grafana for Kubernetes node monitoring should be implemented as a complete monitoring stack and not only as a dashboard. Use Prometheus with node-exporter for hardware and operating system metrics, kube-state-metrics for Kubernetes object status, Alertmanager for alert routing, and Grafana for visualization. This approach will give your infrastructure teams visibility into CPU, memory, disk, filesystem, network, and node readiness before everything else. At Octopus Computer Solutions, this type of Kubernetes monitoring design is part of building reliable, observable, and production-ready container platforms for our customers.