Executive Summary
Our production Kubernetes cluster experienced a critical performance crisis where all three master nodes were cyclically crashing. The issue manifested as 100% CPU usage, memory exhaustion (32GB), and extreme disk I/O spikes (3-4GB reads), causing the Linux OOM killer to terminate critical Kubernetes components including the API server, scheduler, and controller manager. In the following guide I will show How etcd Bloat Took Down Our Kubernetes Control Plane and what we’ve done to resolve it.
Root Cause: ETCD database bloat from accumulated Kyverno policy reports (181,000+ entries)
Impact: Cluster instability, pod restarts, service disruptions
Resolution: Systematic cleanup of ephemeral ETCD entries and implementation of monitoring
What is etcd in Kubernetes and why its performance matters
etcd is Kubernetes’ distributed key-value database and the single source of truth for the entire cluster state. Every critical object like nodes, pods, deployments, secrets, configmaps, RBAC, and more is stored in etcd, and the API server relies on it. When etcd becomes slow due to high CPU, memory pressure, or disk I/O saturation, Kubernetes control plane components can start timing out or fail. This leads to cascading impact such as API unresponsiveness, controller failures, scheduler delays, and eventually control plane instability.
In short: when etcd performance degrades, the whole cluster behaves like it’s going down.
Infrastructure Overview
- Platform: 3 Kubernetes master nodes running as VMs on Proxmox cluster
- Storage: Ceph distributed storage with NVMe OSDs
- Network: Masters and workers in same rack, connected to shared switches via 25Gbps interfaces
- ETCD Version: 3.5.12
- Database Size: 2.4GB per node
- Installation done using Kubespray like in this guide: https://k8s.co.il/kubernetes/how-to-deploy-kubernetes-using-kubespray/
Problem Manifestation
System Symptoms
The crisis presented with a consistent pattern every 10-15 minutes:
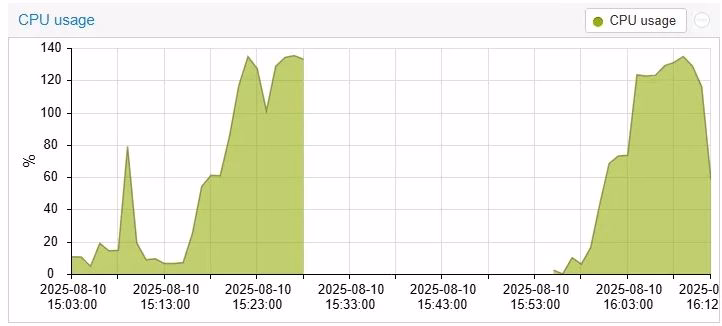
Figure 1: Proxmox monitoring showing 100% CPU utilization and memory exhaustion on master node during the crisis
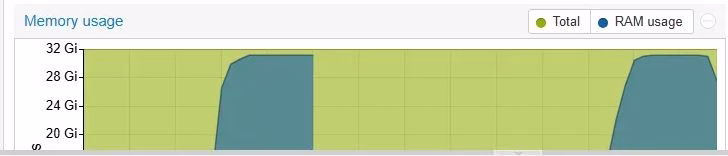
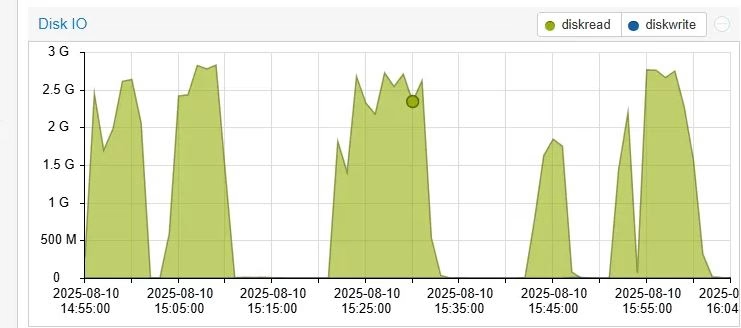
Figure 2: Extreme disk I/O activity with read spikes reaching 3-4GB during ETCD operations
Kubernetes Component Failures
The resource exhaustion triggered cascading failures:
root@k8s-bastion-prod-xxx:/home/master/prod# k get pod -n kube-system | grep sch
kube-scheduler-k8s-master-prod-01-xxx    0/1   CrashLoopBackOff   98 (2m2s ago)   395d
kube-scheduler-k8s-master-prod-02-xxx    0/1   Error              132 (9m10s ago) 394d
kube-scheduler-k8s-master-prod-03-xxx    0/1   Running            132 (3m23s ago) 394d
ETCD Health Degradation
ETCD endpoints became unresponsive with timeout errors:
root@k8s-master-prod-02-xxx:~# sudo etcdctl endpoint health
{"level":"warn","ts":"2025-08-10T15:45:23.207618+0300","logger":"client","caller":"v3@v3.5.12/retry_interceptor.go:62","msg":"retrying of unary invoker failed","target":"etcd-endpoints://0xc00015ca80/10.x.x.25:2379","attempt":0,"error":"rpc error: code = DeadlineExceeded desc = context deadline exceeded"}

+--------------------------+--------+--------------+---------------------------+
|         ENDPOINT         | HEALTH |     TOOK     |           ERROR           |
+--------------------------+--------+--------------+---------------------------+
| https://10.x.x.25:2379 |  false | 5.002562165s | context deadline exceeded |
| https://10.x.x.24:2379 |  false | 5.002525518s | context deadline exceeded |
+--------------------------+--------+--------------+---------------------------+
Troubleshooting Methodology
Proxmox Infrastructure Analysis
All infrastructure-level diagnostics returned healthy results, confirming the issue was not at the hardware or virtualization layer:
1. Ceph Storage Health (All Clear):
ceph status– Cluster healthyceph osd status– All OSDs operationalceph pg stat– Placement groups healthyceph osd perf– Performance within normal ranges
2. Network Connectivity (All Clear):
pingtests between all nodes – Normal latencymtrnetwork trace reports – No packet loss- 25Gbps interface utilization – Within capacity
- Switch port statistics – No errors or drops
3. VM Resource Status (All Clear):
- Proxmox resource allocation – Sufficient headroom
- Ceph mount points – Properly mounted and responsive
- No resource contention between VMs detected
Kubernetes-Level Diagnostics
With infrastructure confirmed healthy, the investigation focused on Kubernetes-level components and their resource consumption patterns.
1. ETCD Database Deep Dive Analysis:
The systematic approach to ETCD analysis revealed the smoking gun:
# Step 1: Export complete ETCD keyspace
$ ETCDCTL_API=3 etcdctl get "" --keys-only --prefix \
  --endpoints=https://10.x.x.24:2379,https://10.x.x.25:2379,https://10.x.x.26:2379 \
  --cert=/etc/ssl/etcd/ssl/node-k8s-master-prod-01-xxx.pem \
  --key=/etc/ssl/etcd/ssl/node-k8s-master-prod-01-xxx-key.pem \
  --cacert=/etc/ssl/etcd/ssl/ca.pem \
  --command-timeout=30s > /tmp/etcd_keys.dump

# Step 2: Analyze top-level resource distribution
$ cat /tmp/etcd_keys.dump | awk -F "/" '{print $3}' | sort | uniq -c | sort -rn
Results revealed catastrophic imbalance:
 193513  [blank entries - registry metadata]
 181193  reports.kyverno.io  ################# ROOT CAUSE
   5631  events
    549  pods
    542  services
    417  crd.projectcalico.org
    330  configmaps
    269  controllerrevisions
    260  replicasets
Step 3: Drill down into problematic resource:
# Investigate Kyverno reports distribution
$ cat /tmp/etcd_keys.dump | grep reports.kyverno.io | awk -F "/" '{print $5}' | sort | uniq -c
 130078  rook-ceph
  51115  velero
      1  v1.reports.kyverno.io
      1  ephemeralreports.reports.kyverno.io
Step 4: Sample actual content to understand data nature:
# Examine sample Kyverno report content
SAMPLE_KEY=$(cat /tmp/etcd_keys.dump | grep "reports.kyverno.io/ephemeralreports" | head -1)
ETCDCTL_API=3 etcdctl get "$SAMPLE_KEY" --print-value-only | head -20
The content analysis confirmed these were ephemeral policy violation reports – temporary logs that should have been cleaned up automatically but had accumulated over months.
2. Resource Consumption Investigation:
System-level diagnostics confirmed ETCD as the performance bottleneck:
CPU and Memory Analysis:
kubectl top nodes– Master nodes showing sustained high resource usagehtopon master nodes –etcdprocess consuming 90-100% CPU during query operationsfree -h– Memory exhaustion (31-32GB used of 32GB) due to ETCD cache pressure
Disk I/O Analysis:
iostat -x 1– Extreme read operations (3-4GB) correlating with ETCD startup and compaction- NVMe disk utilization – 100% during ETCD database operations
- Ceph OSD metrics – Healthy performance, bottleneck was at the ETCD application layer
Kubernetes Events Analysis:
kubectl get events --all-namespaces– Excessive scheduling failures due to API server unavailability- Event logs showing recurring OOMKilled events for system pods
- API server logs indicating ETCD timeout errors during high-load periods
Pod Restart Pattern Analysis:
kubectl get pods -n kube-system– Consistent CrashLoopBackOff patterns- System pods failing health checks due to resource starvation
- Rolling failures across all three master nodes in sequence
Root Cause Analysis
The Critical Discovery: 181,193 Kyverno ephemeral policy reports represented 94% of all ETCD keys, creating massive overhead for:
- Database queries and indexing
- Memory consumption for caching
- Disk I/O during compaction operations
- Network serialization between ETCD nodes
Timeline Analysis: The reports had accumulated over approximately 6 months, with the heaviest concentration from:
- Rook-Ceph operations (130,078 reports)
- Velero backup processes (51,115 reports)
Performance Impact: Each ETCD operation was processing nearly 200,000 keys instead of the typical 10,000-15,000, causing exponential performance degradation.
Solution Implementation
Immediate Emergency Resolution
Phase 1: Emergency Cleanup
# Remove Kyverno ephemeral reports from rook-ceph namespace
ETCDCTL_API=3 etcdctl del --prefix /registry/reports.kyverno.io/ephemeralreports/rook-ceph \
  --endpoints=https://10.x.x.24:2379,https://10.x.x.25:2379,https://10.x.x.26:2379 \
  --cert=/etc/ssl/etcd/ssl/node-k8s-master-prod-01-xxx.pem \
  --key=/etc/ssl/etcd/ssl/node-k8s-master-prod-01-xxx-key.pem \
  --cacert=/etc/ssl/etcd/ssl/ca.pem
# Result: 95,698 entries deleted

# Remove Kyverno ephemeral reports from velero namespace
ETCDCTL_API=3 etcdctl del --prefix /registry/reports.kyverno.io/ephemeralreports/velero \
  --endpoints=https://10.x.x.24:2379,https://10.x.x.25:2379,https://10.x.x.26:2379 \
  --cert=/etc/ssl/etcd/ssl/node-k8s-master-prod-01-xxx.pem \
  --key=/etc/ssl/etcd/ssl/node-k8s-master-prod-01-xxx-key.pem \
  --cacert=/etc/ssl/etcd/ssl/ca.pem
# Result: 23,226 entries deleted
Immediate Impact:
- Total cleanup: 118,924 problematic entries removed (65% reduction)
- CPU usage: Dropped from 100% to normal levels within minutes
- Memory pressure: Reduced from 32GB to 18-20GB usage
- Disk I/O: Eliminated 3-4GB read spikes
- Pod stability: System pods stopped crashing, CrashLoopBackOff resolved
Phase 2: Verification
# Confirm cluster health restoration
$ ETCDCTL_API=3 etcdctl endpoint status --write-out=table
kubectl get nodes
kubectl get pods -n kube-system
Now that we know how etcd bloat tookd own our kubernetes control plane, we can start mitigating the issue.
Post-Resolution Status
After cleanup, the cluster achieved stable operation:
root@k8s-master-prod-01-xxx:~# ETCDCTL_API=3 etcdctl endpoint status
+--------------------------+------------------+---------+---------+-----------+------------+-----------+------------+--------------------+--------+
|         ENDPOINT         |        ID        | VERSION | DB SIZE | IS LEADER | IS LEARNER | RAFT TERM | RAFT INDEX | RAFT APPLIED INDEX | ERRORS |
+--------------------------+------------------+---------+---------+-----------+------------+-----------+------------+--------------------+--------+
| https://10.x.x.24:2379 | f3b25ccf4d71f345 |  3.5.12 |  2.4 GB |     false |      false |       117 |  345544847 |          345544847 |        |
| https://10.x.x.25:2379 | a5f091fbbaaac69a |  3.5.12 |  2.4 GB |      true |      false |       117 |  345544847 |          345544847 |        |
| https://10.x.x.26:2379 | 5715e7fd6dacb34c |  3.5.12 |  2.4 GB |     false |      false |       117 |  345544847 |          345544847 |        |
+--------------------------+------------------+---------+---------+-----------+------------+-----------+------------+--------------------+--------+
Current healthy metrics:
- Total ETCD keys: 13,926 (down from 181K+)
- Largest resource group: velero.io (2,466 entries – manageable)
- System stability: No more crashes or resource exhaustion
- Response times: ETCD queries returning in milliseconds instead of seconds
Long-term Prevention Solution
Automated Monitoring System
Created a comprehensive monitoring script (etcd-daily-monitor.sh) that:
- Daily exports and analyzes ETCD key distribution
- Categorizes resources by deletion safety level
- Implements threshold-based alerting
- Tracks growth patterns over time
- Stores historical data for trend analysis
Key Features:
- Critical Alert: >50,000 keys for single resource type
- Warning Alert: >10,000 keys for single resource type
- Safety Classification: Resources categorized as SAFE_DELETE, CONDITIONAL_DELETE, or NEVER_DELETE
- Growth Tracking: Daily comparison to detect rapid accumulation
Prevention Strategy
1. Proactive Monitoring:
- Daily ETCD health checks via cron
- Automated alerting for key count thresholds
- Historical trend analysis
2. Resource Cleanup Policies:
- Kyverno ephemeral report retention policies
- Regular cleanup of expired backup metadata
- Event log rotation
3. Infrastructure Monitoring:
- Proxmox resource utilization dashboards
- Ceph storage performance monitoring
- Network latency tracking between nodes
Key Learnings
- ETCD Bloat is Silent but Deadly: Performance degradation can occur gradually before becoming critical
- Ephemeral Resources Need Management: Policy engines and backup tools can generate significant metadata
- Infrastructure Can Be Red Herring: Despite healthy Ceph and 25Gbps networking, the bottleneck was application-level
- Systematic Analysis is Crucial: The root cause was only discoverable through methodical ETCD key analysis
- Monitoring is Essential: Proactive monitoring prevents crisis situations
Conclusion
This incident demonstrates the critical importance of ETCD health monitoring and How etcd Bloat Took Down Our Kubernetes Control Plane. What appeared as a complex infrastructure problem with multiple failing components was ultimately resolved by identifying and cleaning accumulated ephemeral policy reports.
Despite having robust infrastructure (25Gbps networking, NVMe-backed Ceph storage, and sufficient VM resources), the crisis originated from application-level resource accumulation within ETCD. The systematic approach to troubleshooting – starting with infrastructure verification and progressing to application-level analysis – proved essential in identifying the true root cause.
The implementation of automated monitoring and cleanup procedures ensures this type of crisis is detected and resolved before impacting cluster stability.
Recommendation: All production Kubernetes clusters should implement similar ETCD monitoring and cleanup automation to prevent resource exhaustion crises, regardless of underlying infrastructure robustness. Regular ETCD key analysis should be part of standard operational procedures.
To learn more about the internals of etcd you can read etcd tutorials on their website.