Installation and Setup Instructions
Installation:
1. Clone the repository:
git clone https://github.com/tTomeRr/InsightSphere.git2. Navigate to the repository in your computer
3. In the Project’s folder go to the setup directory:
cd setup4. Run the ‘setup.yml’ Ansible playbook:
ansible-playbook setup.ymlSetup:
Now let’s understand how we can dynamically configure our project to meet our needs. Inside the setup folder, you will find the ‘inventory.ini‘ file and the ‘values.yml‘ file. Each of these files serves a specific purpose, and we will now explore each file to fully understand its role in our project.
inventory.ini
[local]
localhost ansible_connection=local

[node_exporters]
tomer-ansible-machine

[proxmox]
proxmox-1

[network]
network-1
tomer-ansible-machine

[storage]
storage-1
tomer-ansible-machine

[kubernetes]
kube-1
tomer-ansible-machine
The inventory.ini file is responsible for setting the environment for our project. We have six groups. The first group, ‘local,’ represents our machine. This is where Prometheus, Grafana, and the entire infrastructure will be built upon. Then, we have five different groups for five different types of exporters. In each group, you will list the computers on which you want to install the exporters. You can use either an FQDN or an IP address. Each computer listed in these groups will be installed with the correct exporter, and it will also be added to the Prometheus configuration file for data scraping.
values.yml
prometheus_url: "prometheus.insightsphere.com"
prometheus_chart_name: "prometheus"
prometheus_release_name: "prometheus-community"
prometheus_chart_url: "https://prometheus-community.github.io/helm-charts"

grafana_url: "grafana.insightsphere.com"
grafana_chart_name: "grafana"
grafana_release_name: "grafana"
grafana_chart_url: "https://grafana.github.io/helm-charts"

alertmanager_url: "alertmanager.insightsphere.com"

metallb_namespace: "metallb-system"

exporters_types:
  - "node_exporter"
  - "snmp_exporter"
  - "kubernetes"
  - "proxmox"
  - "storage"

helm_version: "v3.13.1"
kubectl_version: "v1.29.3"
kind_version: "v0.22.0"
docker_ce_version: "3:26.0.0-1.fc39.x86_64"
docker_ce_cli_version: "1:26.0.0-1.fc39.x86_64"
containerd_io_version: "1.6.28-3.2.fc39.x86_64"
docker_compose_version: "1.29.2-10.fc39.noarch"
The values.yml file is used to dynamically change the project configuration. You can modify the URL of the servers or the version of Helm you want to use. This file is the primary location for making such changes, and they will be dynamically applied across the entire project.
The Kubernetes Cluster Environment:
After executing the ‘setup.yml‘ playbook, you will have the following Kubernetes configuration in your cluster:
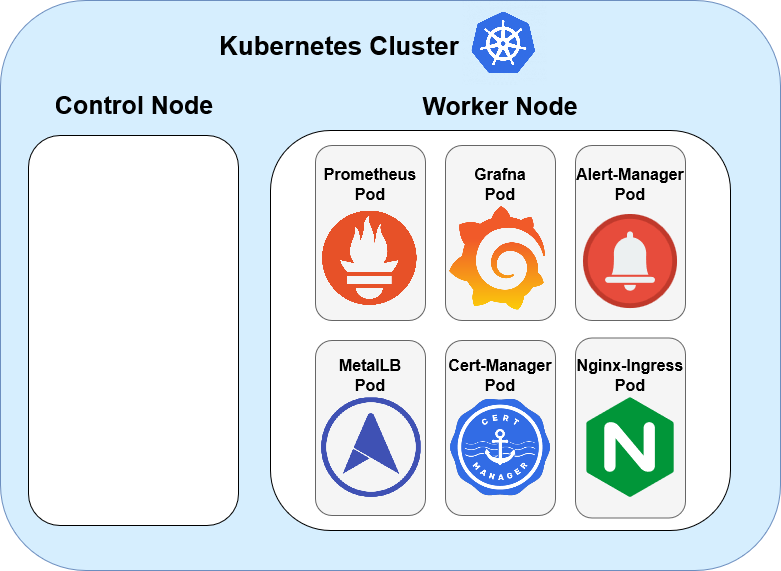
This Kubernetes cluster has six pods. First, we set up a MetalLB pod, which gives out IP addresses for the ingress controller. Then we use the NGINX Ingress Controller as a reverse proxy, which lets us reach our services like Prometheus, Alertmanager, and Grafana using different web addresses. Finally, we have a Cert-Manager pod that helps keep our connections safe with HTTPS.
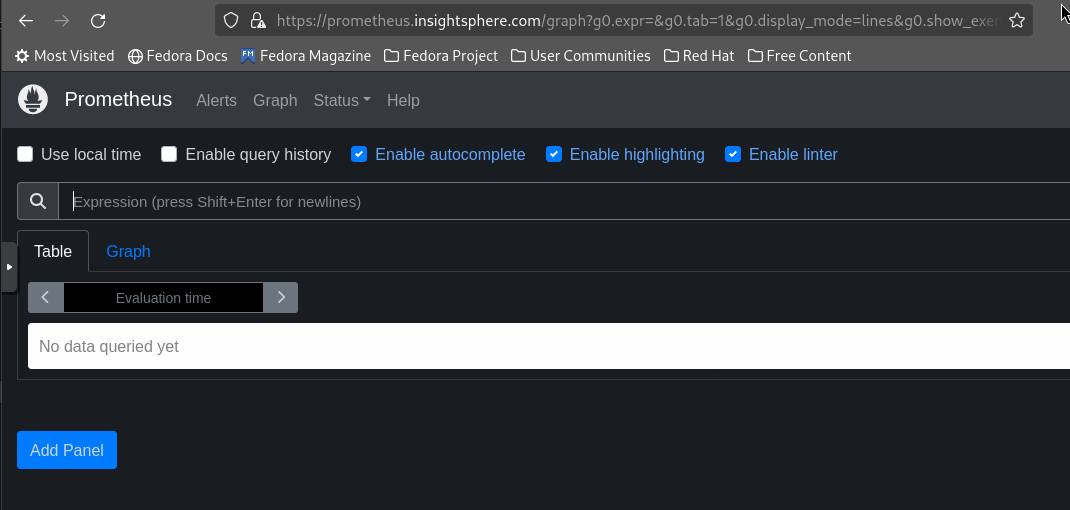
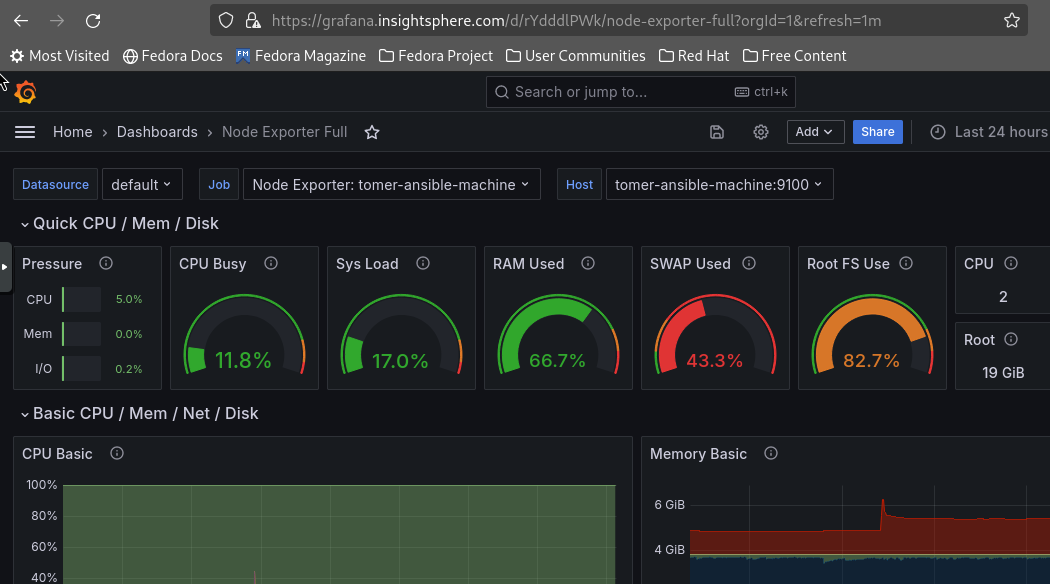
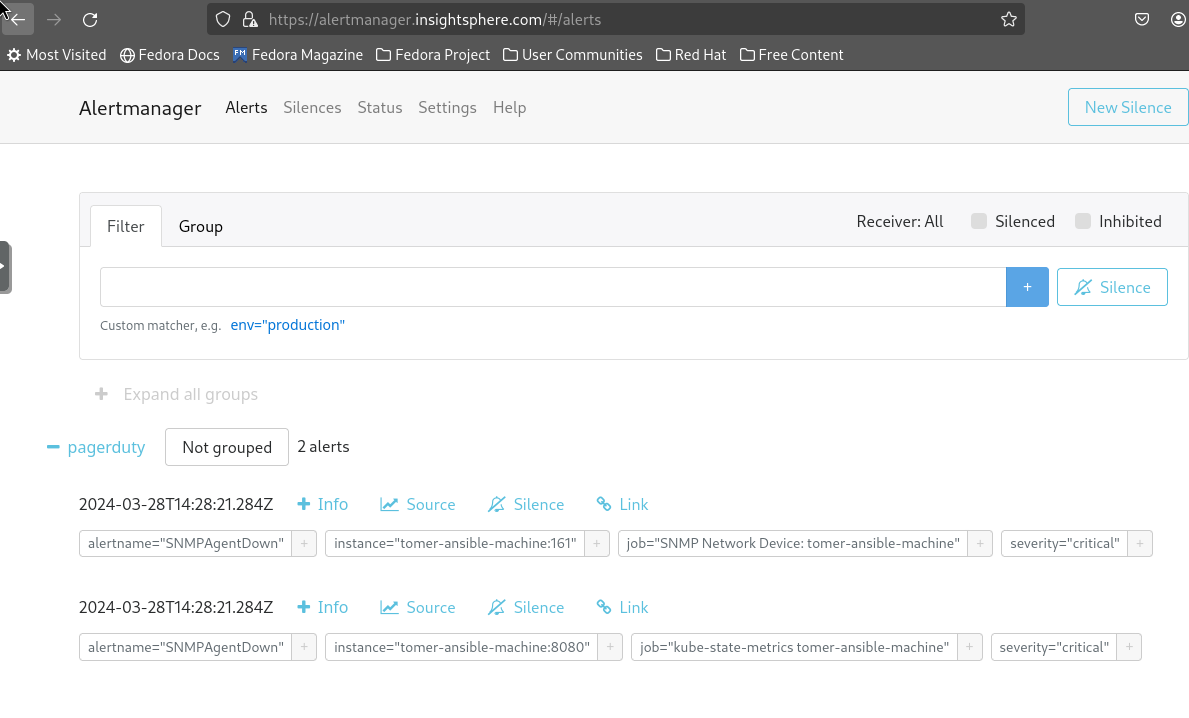
Accessing The Services:
All of the servers can be accessed by this URL’s:
– prometheus.insightsphere.com
– grafana.insightsphere.com
– alertmanager.insightsphere.com
Summary
Our project entails deploying a monitoring solution for hosting environments using Grafana and Prometheus within Kubernetes.
It includes custom dashboards for Proxmox hosts, Node Exporter, Kubernetes environment, storage (e.g., NetApp), and network monitoring.
Key features include custom dashboards for different hosting layers, alert configuration via PagerDuty, and a detailed upgrade process demonstration from version x to version y.