Introduction
Optimizing performance testing in OpenShift with Ripsaw enables you to establish a strong baseline for your cluster. This guide will guide you through the installation of Ripsaw, using the Fio workload to simulate I/O operations and evaluate system efficiency. We’ll also cover how to set up Elasticsearch for data collection and visualization, helping you ensure your Kubernetes environment stays in top shape.
Prerequisites
- Administrative access to the cluster, with sufficient permissions.
- Kubectl or oc CLI tools are installed and configured to the cluster.
- Linux VM / RHEL 8 VM.
- Helm for more details. Helm-Installation.
What is Ripsaw?
Ripsaw is an open-source benchmarking operator that simplifies performance testing and workload simulation in Kubernetes and OpenShift. It automates the deployment of various tools, such as fio, iperf3, sysbench, pgbench, and smallfile, to help establish a performance baseline for your cluster. Ripsaw’s flexibility allows for custom workloads, and its integration with Elasticsearch enables efficient data collection, visualization, and analysis to quickly identify bottlenecks and ensure optimal cluster performance.
Procedure
Installing the Benchmarking Operator for Enhanced Performance Testing in OpenShift with Helm
To install Ripsaw for performance benchmarking with Helm, start by ensuring Helm is set up in your Kubernetes or OpenShift environment. Helm allows you to easily install Ripsaw and its configurations, making the process quick and straightforward. Follow the steps and commands below to get Ripsaw running and begin optimizing your performance testing.
Run the following command to install the Ripsaw operator.
$ git clone https://github.com/cloud-bulldozer/benchmark-operator
$ cd benchmark-operator/charts/benchmark-operator
$ oc create namespace benchmark-operator
$ oc adm policy -n benchmark-operator add-scc-to-user privileged -z benchmark-operator
$ helm install benchmark-operator -n benchmark-operator --create-namespace
If you’re in a disconnected environment, make sure to copy the Helm chart to your offline machine before starting the installation.
$ cp benchmark-operator/ <username>@<server-ip>/<path>
$ oc create namespace benchmark-operator
$ oc adm policy -n benchmark-operator add-scc-to-user privileged -z benchmark-operator
$ helm install benchmark-operator -n benchmark-operator --create-namespace
Install Elasticsearch: Unlock the Power of Search and Analytics
Installing the Elasticsearch operator is easy and requires just a few simple commands. This operator helps you manage cluster health, handle indices, and run efficient search queries. Follow these steps to set it up and make the most of your data.
If you’re in a connected environment, follow these steps to install Ripsaw:
$ oc create -f https://download.elastic.co/downloads/eck/2.14.0/crds.yaml
$ oc apply -f https://download.elastic.co/downloads/eck/2.14.0/operator.yaml
$ oc new-project elastic
If you are working in a disconnected environment, please follow these steps to ensure a successful installation.
$ https://download.elastic.co/downloads/eck/2.14.0/crds.yaml
$ https://download.elastic.co/downloads/eck/2.14.0/operator.yaml
$ oc apply -f crds.yaml
$ oc apply -f operator.yaml
To deploy an Elasticsearch instance with a route, you can use the following code to create a cluster named elasticsearch-sample and set up a ‘passthrough’ route for easy access. This allows you to interact with your Elasticsearch instance seamlessly.
$ cat <<EOF | oc apply -n elastic -f -
apiVersion: elasticsearch.k8s.elastic.co/v1
kind: Elasticsearch
metadata:
  name: elasticsearch-sample
spec:
  version: 8.15.1
  nodeSets:
  - name: default
    count: 1
    config:
      node.store.allow_mmap: false
---
apiVersion: route.openshift.io/v1
kind: Route
metadata:
  name: elasticsearch-sample
spec:
  tls:
    termination: passthrough
    insecureEdgeTerminationPolicy: Redirect
  to:
    kind: Service
    name: elasticsearch-sample-es-http
EOF
Deploying a Kibana instance is important for visualizing your Elasticsearch data. Use the following code to create a Kibana instance with a passthrough route for easy access.
$ cat <<EOF | oc apply -n elastic -f -
apiVersion: kibana.k8s.elastic.co/v1
kind: Kibana
metadata:
  name: kibana-sample
spec:
  version: 8.15.1
  count: 1
  elasticsearchRef:
    name: "elasticsearch-sample"
  podTemplate:
    spec:
      containers:
      - name: kibana
        resources:
          limits:
            memory: 1Gi
            cpu: 1
---
apiVersion: route.openshift.io/v1
kind: Route
metadata:
  name: kibana-sample
spec:
  tls:
    termination: passthrough
    insecureEdgeTerminationPolicy: Redirect
  to:
    kind: Service
    name: kibana-sample-kb-http
EOF
Access the Elasticsearch UI
To log in to the Kibana UI, enter the Kibana route URL in your browser. The default username is elastic, and the password is automatically generated. To get the generated password, run the command below.
$ oc get -n elastic secret elasticsearch-sample-es-elastic-user -o go-template='{{.data.elastic | base64decode}}'Using Fio for Effective Performance Testing
Fio (Flexible I/O Tester) was designed to make I/O workload testing easier, whether for performance evaluation or bug reproduction. Fio provides a versatile solution, letting you simulate different I/O workloads without needing to create new test cases each time.
Edit the cr.yaml file to customize it for your needs. You can change the number of pods and select the storage class to test.
| $ cd ~/helm/benchmark-operator/config/samples/fio/ |
cr.yaml
apiVersion: ripsaw.cloudbulldozer.io/v1alpha1
kind: Benchmark
metadata:
  name: fio-benchmark-example
  namespace: benchmark-operator
spec:
  elasticsearch:
    url: http://my.elasticsearch.server:80
    verify_cert: false
    parallel: false
  workload:
    name: "fio_distributed"
    args:
      prefill: true
      samples: 3
      servers: 3
      pin_server: ''
      jobs:
        - write
        - read
        - randwrite
        - randread
      bs:
       #  - 4KiB
        - 64KiB
      numjobs:
        - 1
      iodepth: 4
      read_runtime: 15
      write_runtime: 15
      read_ramp_time: 5
      write_ramp_time: 5
      filesize: 2GiB
      log_sample_rate: 3000
      storageclass: rook-ceph-block
      storagesize: 5Gi
  job_params:
    - jobname_match: write
      params:
        - fsync_on_close=1
        - create_on_open=1
        - runtime={{ workload_args.write_runtime }}
        - ramp_time={{ workload_args.write_ramp_time }}
    - jobname_match: read
      params:
        - time_based=1
        - runtime={{ workload_args.read_runtime }}
        - ramp_time={{ workload_args.read_ramp_time }}
    - jobname_match: rw
      params:
        - rwmixread=50
        - time_based=1
        - runtime={{ workload_args.read_runtime }}
        - ramp_time={{ workload_args.read_ramp_time }}
    - jobname_match: readwrite
      params:
        - rwmixread=50
        - time_based=1
        - runtime={{ workload_args.read_runtime }}
        - ramp_time={{ workload_args.read_ramp_time }}
    - jobname_match: randread
      params:
        - time_based=1
        - runtime={{ workload_args.read_runtime }}
        - ramp_time={{ workload_args.read_ramp_time }}
    - jobname_match: randwrite
      params:
        - time_based=1
        - runtime={{ workload_args.write_runtime }}
        - ramp_time={{ workload_args.write_ramp_time }}
    - jobname_match: randrw
      params:
        - time_based=1
        - runtime={{ workload_args.write_runtime }}
        - ramp_time={{ workload_args.write_ramp_time }}
Now, apply the YAML configuration to set up Ripsaw.
$ oc apply -f cr.yamlMonitor the benchmark, pods, and PVCs to ensure that the resources are ready and the benchmark is functioning properly.
$ watch oc get benchmark,po,pvc
NAME TYPE STATE METADATA STATE CERBERUS SYSTEM METRIC
S UUID AGE
benchmark.ripsaw.cloudbulldozer.io/fio-benchmark fio_distributed Running not collected Not collected
fae2a51d-ae8d-5cac-8e65-c038e1b03174 3m39s
NAME READY STATUS RESTARTS AGE
pod/benchmark-operator-5cfb5854cc-cmgjh 2/2 Running 4 23d
pod/fio-benchmark-28806710-d8x27 0/1 Completed 0 3m44s
pod/fio-client-fae2a51d-lsprl 1/1 Running 0 12s
pod/fio-server-1-benchmark-fae2a51d 1/1 Running 0 38s
pod/fio-server-2-benchmark-fae2a51d 1/1 Running 0 36s
pod/fio-server-3-benchmark-fae2a51d 1/1 Running 0 33s
NAME STATUS VOLUME CAPACITY ACCESS MODES STORAGECLASS
AGE
persistentvolumeclaim/claim1-ae5ffa8f Bound pvc-30d1c5da-ef72-4153-8b0f-867097c645ba 10Gi RWO lvms-vg1
13s
persistentvolumeclaim/claim2-fdjsk3fx Bound pvc-0d859cd5-a98a-5a99-8df8-06464 10Gi RWO lvms-vg1
13s
persistentvolumeclaim/claim3-kfjnd9fdfa8f Bound pvc-099cn25ag-xw72-5cfb5854cc-cmgjh 10Gi RWO lvms-vg1
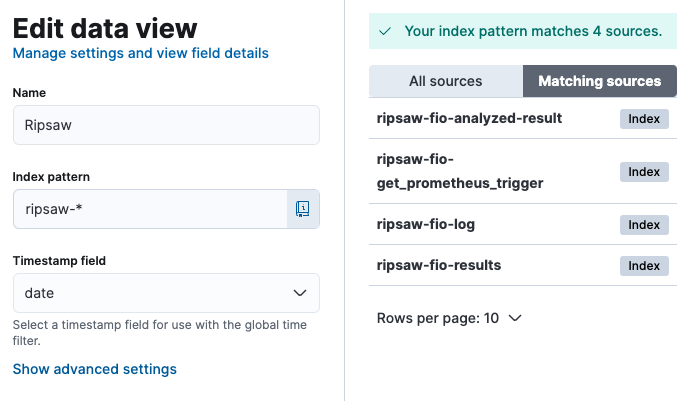
13sCreating an Elasticsearch Data View
Select Analytics from the home page.

Creating and Configuring a Data View.
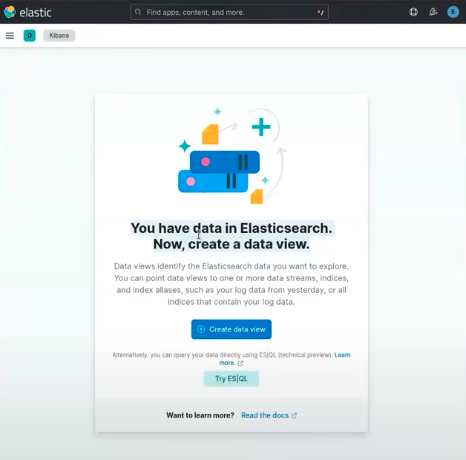
Choose a name for your data view, define the index pattern, and specify the timestamp field to ensure accurate data organization and retrieval.
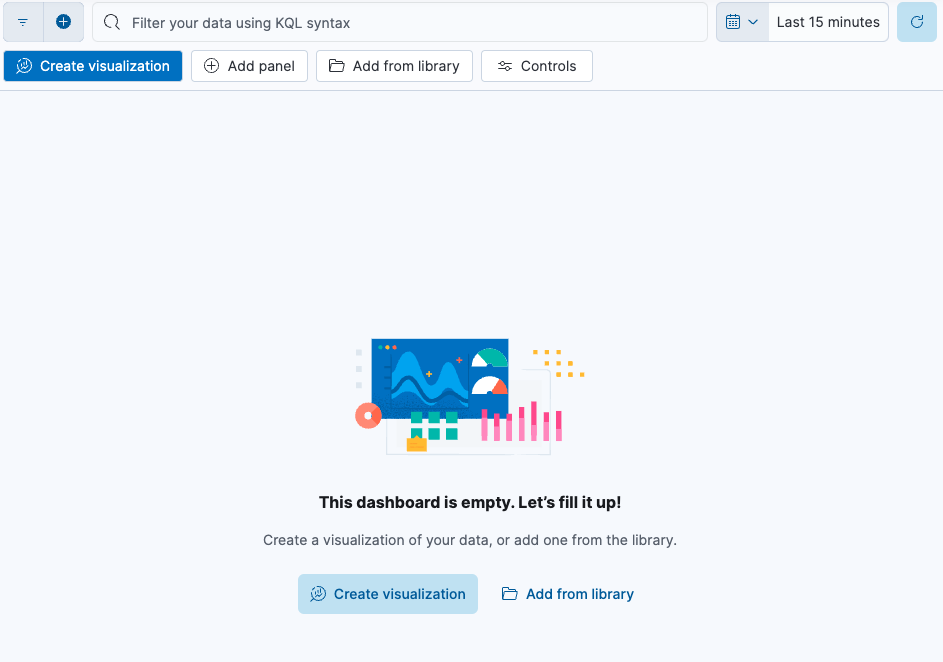
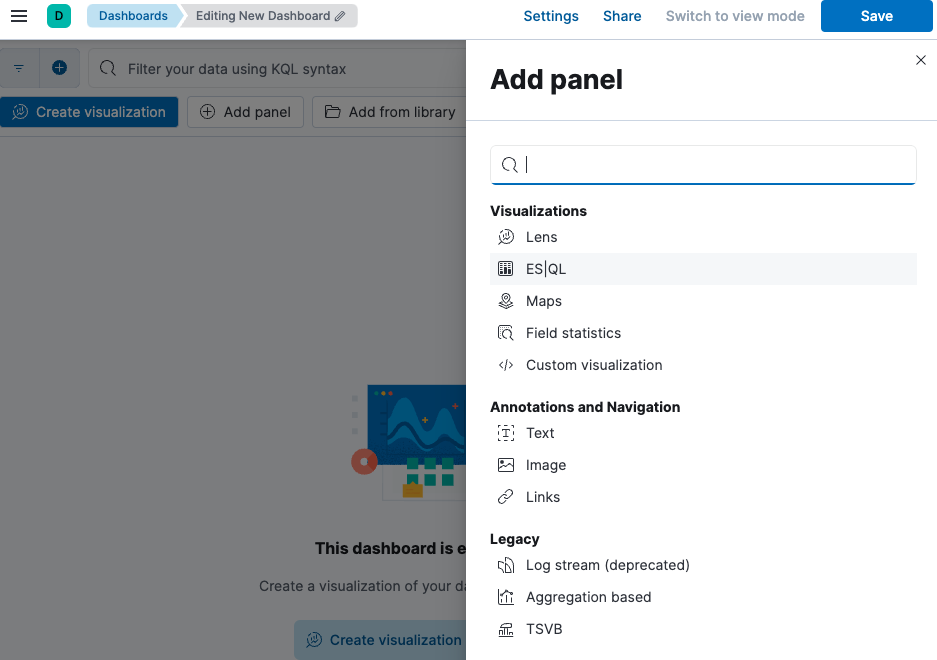
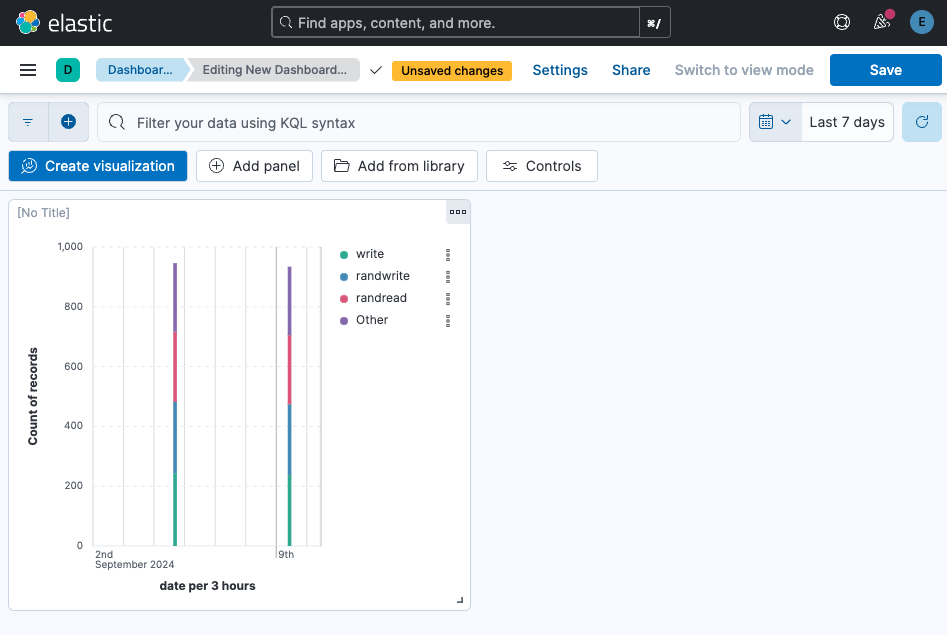
Create a dashboard and add panels to it. In this case, select the Lens option for better data visualization.
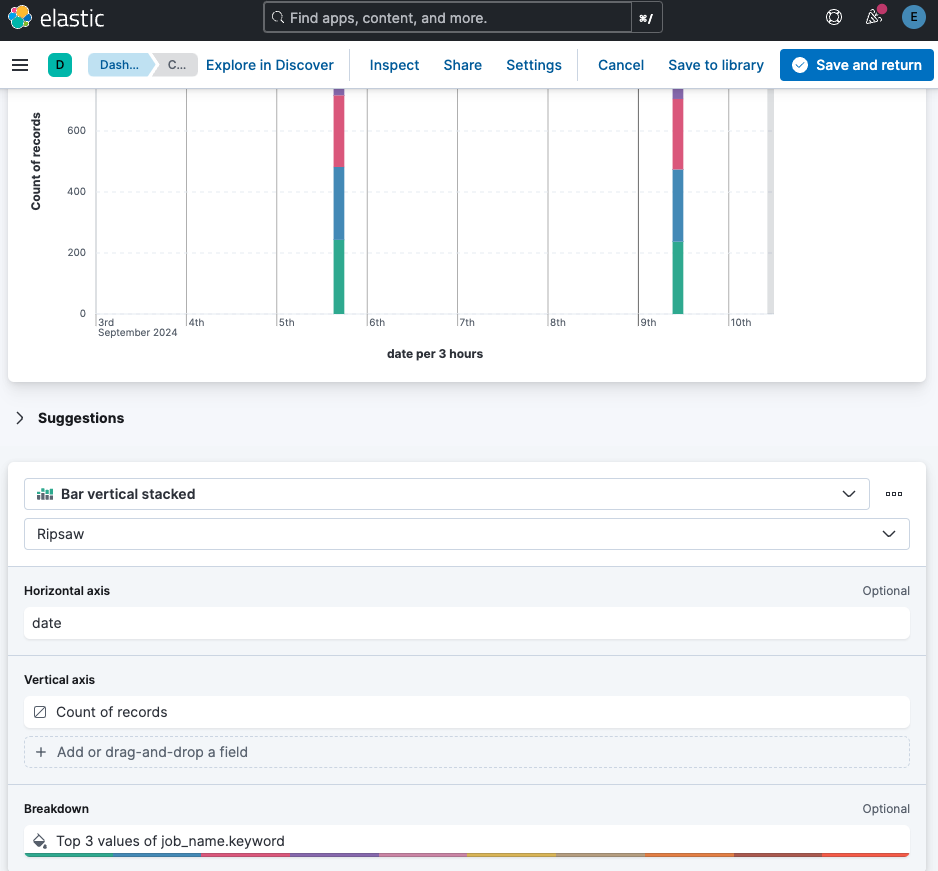
In the new panel, select your preferred bar type and configure the horizontal and vertical axes. The available options will vary based on the test you choose, such as fio.
Summary
In this post on optimizing performance testing in OpenShift with Ripsaw, we walked through the steps to install and configure Ripsaw with the Fio workload for effective benchmarking. We also covered how to set up Elasticsearch to gather and visualize your data. By using these tools together, you can simplify your testing process, and get meaningful insights into your cluster’s performance. For more insights, check out our other Kubernetes posts!